
This month, YVSC is pleased to introduce our new ‘Get to Know Climate’ series. Each month, YVSC will explore an important climate-related topic through a local lens. Using stories from our landscapes and community members, we hope to increase community knowledge of climate change, its impacts and solutions on a local level. It’s been an awesome winter season, so what better place to start than taking a deeper look into our snowpack?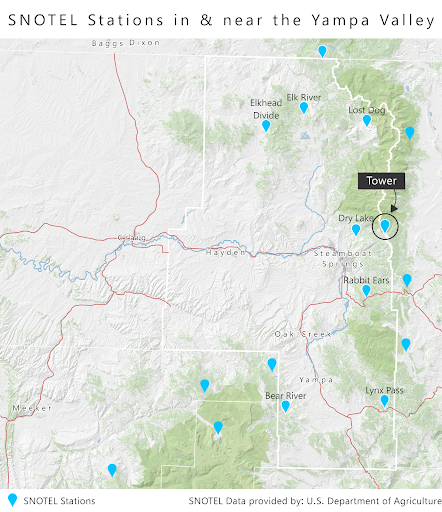
In late March, snow depth at a Buffalo Pass SNOTEL station, the Tower, surpassed 12 feet. Our snowpack is the deepest that we have seen in over a decade since 2011 when the Tower hit a record snow depth of over 15 feet, the deepest snowpack ever recorded in Colorado history. It’s April, and it seems like the snow isn’t quite over yet. The Tower station is one of the many SNOTEL monitoring stations across the valley and throughout the western U.S. operated by the U.S. Department of Agriculture, Natural Resource Conservation Service (figure 1). Long term monitoring stations, like SNOTEL, play an important role in understanding our local climate and water resources.
One way to assess snowpack is by looking at its snow water equivalent (SWE). SWE, pronounced “s-wee”, is a measurement used to determine how much water is in the snowpack. Peak SWE is the date during the year when the snowpack reaches its maximum SWE. The timing and magnitude of peak SWE is used to estimate the amount of water expected to runoff into our rivers and streams during the spring and summer months. Our regional water and resource managers use these values to plan for water use decisions related to agriculture, recreation and flood management.
The amount (depth) of snow our basin receives during the winter is one important indicator of how much water we will have in our streams and rivers the following spring, but not all snow is the same in terms of the amount of water it provides. Our “champagne powder” is light and fluffy because it contains very little water in it. Snow with more water has higher snow-water-equivalent, or SWE.
This month, we are hosting a community challenge to see who can guess the peak snowpack date at the Tower station.
SWE is one of the many variables collected at SNOTEL stations. Use the graph (figure 2) to learn about past SWE patterns and guess this year’s peak at the Tower SNOTEL station! The graph compares a few years of snowpack trends at the Tower. The vertical axis shows SWE magnitude in total inches, indicating how much water the snowpack is holding. The horizontal axis points to the corresponding date and helps us identify the date where the maximum, “peak” SWE; note that the shape of these trends are indeed reminiscent of a mountain peak!
The blue line follows SWE throughout 2011, when it measured the highest peak SWE value on record on May 28. In orange, the values for 2012, just one year later, measured the lowest peak SWE value on record on March 23. We can use patterns from these remarkable years, along with the 30-year median and 2022 peak dates to give us insight on what our SWE magnitude and timing will look like this year.
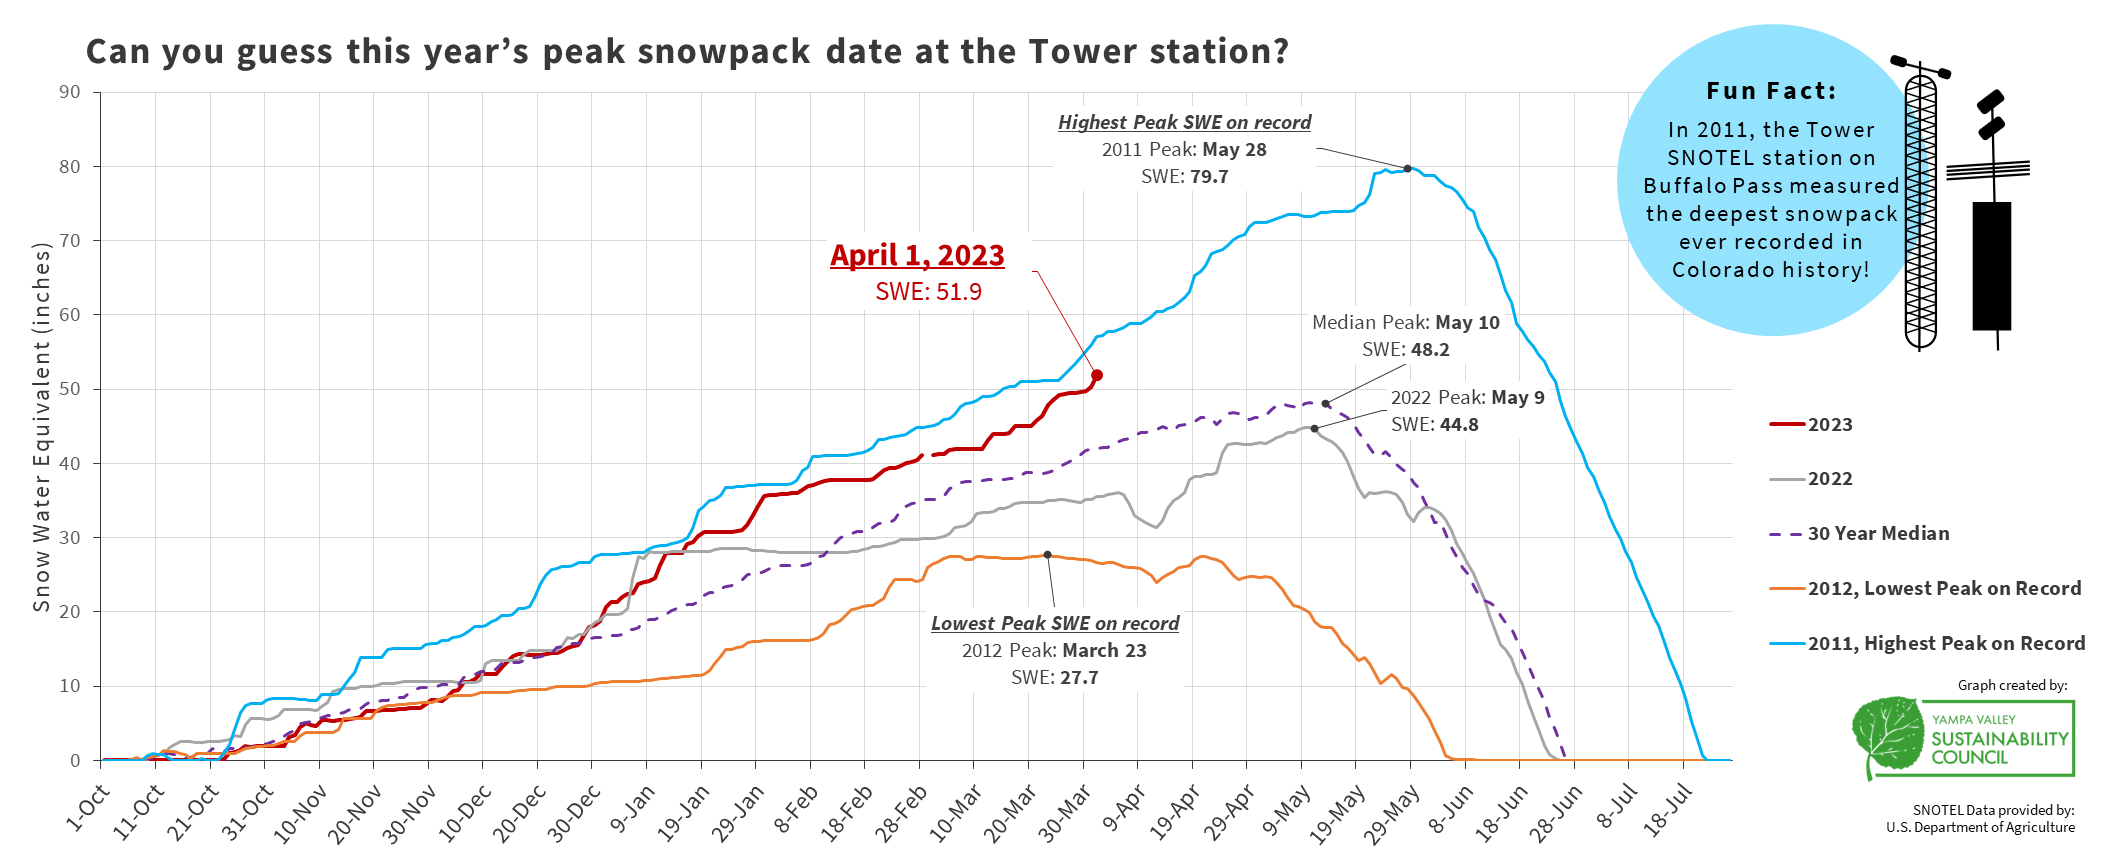
Think you have what it takes to guess the peak SWE date? Submit your answer at the link below. The contest closes on April 30. All entries for the correct or closest to correct date will be entered to win a raffle. Follow along throughout the month of April to learn more about our snowpack and the important role it plays in our community.
Submit your guess: https://forms.gle/P9fpRJtqn2adHqgL7
Link to map: http://yvsc.org/wp-content/uploads/2023/03/unnamed-14.png
Link to graph: http://yvsc.org/wp-content/uploads/2023/04/Guess-Peak-SWE-updated-1.png
Follow our Get to Know Climate series: http://yvsc.org/get-to-know-climate/